

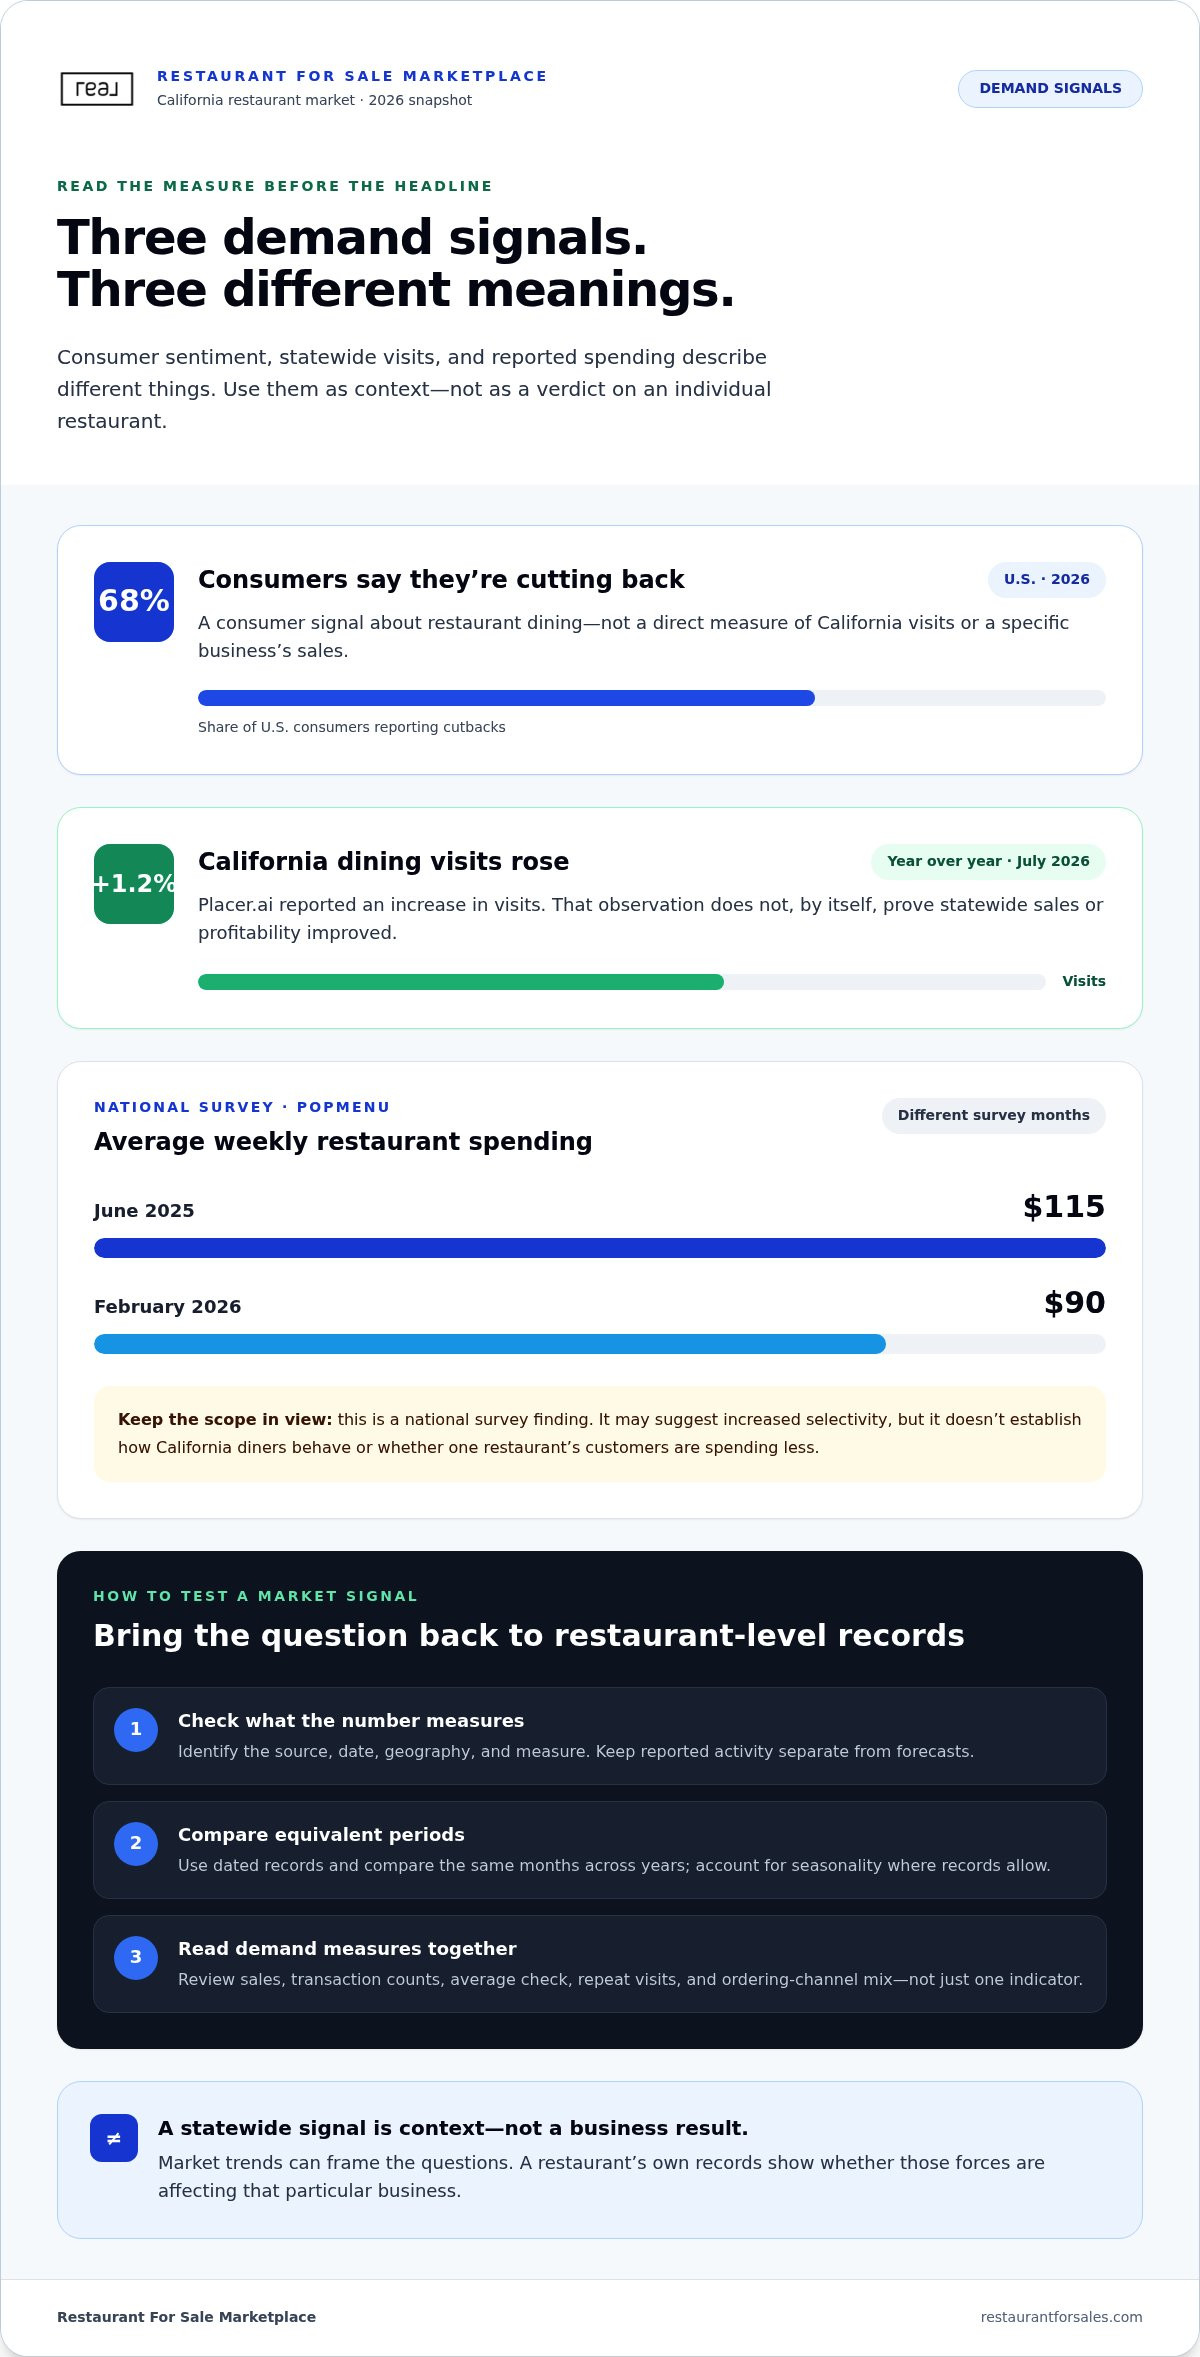
68% of U.S. consumers say they’re cutting back on restaurant dining in 2026, yet California dining visits rose 1.2% year over year in July, according to Popmenu and Placer.ai. That contrast shows why california restaurant market trends need careful interpretation: a statewide signal can point in a different direction from an individual restaurant’s results.
Customer traffic matters, but it doesn’t show on its own whether a restaurant is performing well. Labor and food costs, operating efficiency, concept fit, and the quality of the financial records all shape the picture. Market commentary can frame a decision, but the restaurant’s own evidence must support it.
This article examines the forces shaping restaurants in 2026, including consumer spending, cost pressures, labor, technology, and acquisition opportunities. You’ll learn which sources and restaurant-level indicators to track, and how to use them to evaluate an opportunity without treating a trend as a guarantee. That context can help you assess active listings, prepare for a potential sale, or decide whether brokerage or valuation services fit your next step.
Key Takeaways
- Interpret california restaurant market trends as sustained, measurable shifts, and check the date and scope behind each claim.
- Use customer traffic, average checks, ordering channels, and repeat visits to test whether changing diner preferences affect a specific restaurant.
- Separate labor, food, occupancy, and utility pressures to understand where operating costs may be affecting margins.
- Assess technology and compliance decisions based on their fit with a restaurant’s operations, not as automatic sources of savings or advantage.
- Turn market signals into focused diligence: verify the source, compare the trend with business records, and use gaps to shape acquisition questions.
California Restaurant Market Trends in 2026: The Signals Behind the Headlines
A restaurant market trend is a sustained, measurable shift in customer behavior, operating conditions, or business performance. A report about one closure, a popular new dish, or a busy weekend may be worth investigating, but it doesn’t establish a trend. For owners and buyers, the distinction matters: market signals can inform a decision, but they can’t predict how a particular restaurant will perform.
Read california restaurant market trends through three connected lenses. Demand covers visits, spending, and dining occasions. Operating economics includes labor, food inputs, occupancy, and other expenses. Adaptability considers how a business responds through its concept, workflows, and customer experience. A change in one area can affect the others, but each needs its own supporting evidence.
What counts as a meaningful restaurant market trend?
Look for a consistent direction across multiple dated sources and relevant business indicators, not a single anecdote. For example, Placer.ai reported that California dining visits rose 1.2% year over year in July 2026. That is a dated observation about visits, not proof that sales or profitability improved across the state. Compare it with a restaurant’s own records before drawing conclusions.
Keep forecasts separate from observed results. A projection describes an expected outcome based on assumptions; it isn’t an established result. For each figure, note the source, publication date, geography, and measure, then identify whether it reflects reported activity or a forecast. This makes it harder for broad headlines to become unsupported assumptions in a sale or acquisition decision.
Which sources can substantiate California restaurant trends?
Use each source for the questions it can answer. National Restaurant Association research can provide industry context, but identify the report, publication date, and whether its findings are national, state-level, or based on a particular survey group. U.S. Census Bureau economic data can describe relevant conditions, such as household spending or business activity. It shouldn’t be treated as direct evidence of restaurant demand unless the measure specifically supports that conclusion.
For California-specific context, review California Restaurant Association materials and primary public data. Cite the exact publication or dataset and its date rather than referring vaguely to “industry reports.” The Bureau of Labor Statistics and California public agencies can provide dated measures relevant to costs and employment. Check each source’s geography, time period, and definitions before comparing it with a restaurant’s operating records.
Industry context can also include longer-running changes in food culture. California cuisine offers historical background on a culinary movement associated with the state. It can help frame questions about dining experiences, but it doesn’t establish current customer demand. Apply the same test to any trend: use it to form a specific question, then look for evidence in current traffic, transaction patterns, costs, and repeat visits.
Statewide indicators describe the market; restaurant-level records show whether those forces are affecting a particular business. Treat 2026 as a dated snapshot, not a guarantee of what comes next. That distinction gives owners and buyers a more reliable starting point for evaluating opportunities, risks, and next steps.
Consumer Demand Trends: What California Diners’ Choices May Signal
Demand is more than a busy dining room. Traffic shows how often guests visit, while transaction counts and average check help explain what those visits contribute to sales. Ordering channels, menu mix, and repeat visits add context. Read these measures together to see whether customer behavior is changing and where the change appears, but don’t treat any one of them as a complete picture.
Consumer research can point to questions worth testing. Popmenu reported that U.S. consumers spent an average of $90 per week on restaurants in February 2026, compared with $115 in June 2025. That national survey finding may suggest increased selectivity, but it doesn’t establish how California diners behave or whether a particular restaurant’s customers are spending less. Treat value-seeking, convenience, and changes in dining occasions as hypotheses, not conclusions.
How to read changing dining and ordering preferences
Compare dine-in, takeout, delivery, or catering only if the restaurant’s records track those channels consistently. A shift toward takeout, for instance, means something different if total transactions are steady than if both visits and checks are declining. Review menu mix and visit frequency alongside reported preference changes. National surveys can offer context, but they don’t represent every California concept or customer segment.
Which demand indicators should owners and buyers track?
Use dated records to compare sales, transaction counts, average check, repeat visits, and channel mix. Compare equivalent periods, such as the same months across years, and account for seasonality where records allow. A higher average check alongside fewer transactions tells a different story from growth in both measures. For buyers, these patterns turn broad market questions into focused requests during business diligence.
- Sales and transactions: Check whether revenue changes reflect more visits, larger checks, or both.
- Average check and menu mix: Look for changes in what guests buy and how much they spend per transaction.
- Channel mix: Compare ordering channels only when the records use consistent definitions.
- Repeat visits: Review available customer or loyalty data for signs of returning demand.
Consumer sentiment describes what people say; sales and traffic show what customers actually did at a specific restaurant. Use both, but don’t mistake one for the other. The California Restaurant Association’s Industry Insights can add context on operating issues that shape restaurant decisions. The restaurant’s own dated reports are essential for testing demand.
For buyers, market context is most useful when paired with evidence from the business being evaluated. Reviewing active restaurant listings can help you compare opportunities and identify the sales and customer patterns to examine during diligence.
Restaurant Labor, Operating Costs, and Margin Pressure in 2026
Restaurant costs don’t move as one. Labor availability and compensation affect staffing plans; food inputs influence purchasing and menu decisions; occupancy and utilities create separate fixed or variable pressures. Assess each category independently before deciding whether a restaurant’s margins are under strain.
California’s Department of Industrial Relations set the statewide minimum wage at $16.90 per hour effective January 1, 2026. That is a dated statewide wage benchmark, not a measure of a restaurant’s total labor expense. Actual payroll also reflects staffing levels, hours, scheduling, and other compensation. For price context, the U.S. Bureau of Labor Statistics publishes dated Consumer Price Index releases, but a consumer price index is not the same as a restaurant’s supplier invoices or utility bills. Check the measure’s geographic scope before applying it to a business.
How labor and input costs affect individual operations
Compare schedules, payroll, open shifts, and turnover records with service levels and sales patterns. A restaurant with rising labor expense may also have changed its hours, staffing, or transaction volume. For food costs, review purchasing records alongside menu mix, portion practices, and waste logs. A change in ingredient prices alone doesn’t show its effect on gross margin if the restaurant also changed suppliers, prices, or what customers ordered.
How to distinguish market pressure from business-specific performance
Use external benchmarks to frame questions, then examine the restaurant’s profit-and-loss statements and supporting records. Confirm that reporting periods and accounting categories are comparable. Separate recurring expenses from one-time costs, and check how items such as repairs or owner compensation are recorded before comparing periods or businesses.
Statewide cost data can identify pressure, but only a restaurant’s own records show how that pressure affected its margins. Keep that distinction in view when evaluating california restaurant market trends or assessing an acquisition.
| Market signal | Business record to inspect | Interpretation caution |
|---|---|---|
| Wage benchmark or staffing pressure | Payroll, schedules, turnover, and sales by period | A wage rate doesn’t reveal total labor expense or service impact. |
| Food price movement | Invoices, menu mix, and waste records | Input prices alone don’t establish food-cost percentage or margin. |
| Occupancy expense | Lease documents and rent history | Terms and reporting periods may differ between businesses. |
| Utility price movement | Utility bills matched to operating periods | Usage, season, and business hours can affect the comparison. |
For owners, this review can pinpoint which expense category needs attention. Buyers can use the same framework to focus diligence on payroll, purchasing, lease obligations, and utility history rather than assuming a statewide benchmark predicts a restaurant’s future performance.
Technology, Compliance, and Adaptability: Evaluating Restaurant Resilience
Technology can improve access to sales information or streamline a task, but adopting a tool doesn’t automatically reduce costs or create a competitive advantage. Evaluate digital ordering, point-of-sale reporting, and workflow tools as operating choices. Ask whether a system improves a measurable process, produces reliable information, or helps customers interact with the restaurant in a way that fits its concept.
For owners, compare documented results before and after a change, while accounting for implementation, staff training, and ongoing work. For buyers, understand which systems support daily operations, how records are maintained, and whether the business can continue using the tools effectively. A technology claim is stronger when it connects to an observable result, not just to the fact that a system is in place.
Which technology signals deserve a closer look?
Start with the workflow. Check whether digital ordering gives customers a useful ordering option, whether point-of-sale reports support timely sales analysis, and whether workflow tools help coordinate routine tasks. Then compare the restaurant’s records before and after adoption. Consider setup, training, and continuing operational demands alongside potential benefits. Without measurable evidence, adoption alone doesn’t show that a restaurant is more efficient or resilient.
How to verify regulatory and compliance developments
Separate enacted rules from proposals, commentary, and industry discussion. For each development, identify the primary source, effective date, and businesses it applies to. For example, California’s SB 68 took effect July 1, 2026, and requires chain restaurants with 20 or more locations to provide written notice of major food allergens on menus or through a digital format. Applicability and implementation details matter, so verify them with the relevant California agency before relying on a summary.
Tax questions require a different source. Use the California Department of Tax and Fee Administration for applicable tax guidance, and avoid treating general summaries as advice for a specific operation. Owners and buyers should consult qualified legal or accounting professionals for business-specific interpretation, particularly when a compliance issue could affect operations, records, or transaction diligence.
These checks are part of reading california restaurant market trends carefully. A technology investment, a new requirement, or a proposed change may affect businesses differently depending on their size, operating model, and existing systems. Keep dated records of changes and their observed effects. That makes it easier to distinguish a real operational shift from a headline or an assumption.
For buyers, assess resilience through evidence: current operating workflows, system records, staff processes, and documented compliance practices. Reviewing active restaurant listings can help you identify opportunities, then use targeted diligence to understand how each business’s tools and procedures support its operations.
How Owners and Buyers Can Apply California Restaurant Trends
Market information is useful when it changes what you investigate, not when it replaces evidence. Apply california restaurant market trends to a particular restaurant by moving from a broad claim to a specific question, then checking the answer against business records. This keeps a forecast, survey, or statewide observation from becoming an assumption about one operation.
A practical trend-checking process for buyers
Use a consistent sequence to turn market context into focused diligence:
- Choose one trend. Record the source, publication date, population studied, geography, and measure. Clarify whether it reports observed results or a projection.
- Identify what it could affect. A demand signal might prompt questions about transactions, average checks, or menu mix. A cost signal might focus attention on payroll, purchasing, or occupancy records.
- Test the question against the business. Compare the target’s financial statements and operating records across equivalent periods. Note gaps, unusual changes, and explanations that need support.
For example, a broad report about changing customer preferences doesn’t prove that a particular restaurant has lost repeat visits. The buyer’s diligence should examine the target’s available sales and customer records, then assess whether the observed pattern aligns with the market signal. For broader acquisition steps, use the complete restaurant buying guide.
Market context also isn’t the same as business value. A popular concept or favorable trend doesn’t, by itself, establish earnings, asset condition, lease terms, or a defensible valuation. The 2026 restaurant valuation guide can help clarify how business-specific evidence differs from broad market commentary.
A practical trend-checking process for owners considering a sale
Prepare current financial statements and supporting operating records so performance can be understood and substantiated. Organize reporting periods consistently, document unusual results, and connect operational strengths to evidence rather than general claims. Explain relevant market conditions as context, not as a promise that future results will follow the same pattern. Owners considering a structured sale process can learn about restaurant brokerage services.
Once you’ve assessed your goals and the evidence, the marketplace can be a practical next step. Restaurant For Sale Marketplace connects restaurant and bar buyers and sellers nationwide through active listings, brokerage services, and restaurant valuation services. Buyers can review opportunities with specific diligence questions in mind; owners can organize a sale evaluation around documented business performance.
Put Market Insight to Work on Your Next Decision
Turn your research into a clear decision standard. Before pursuing a purchase or planning a sale, define what evidence would make the opportunity worth advancing, what uncertainties need resolution, and what would prompt you to pause. That standard helps keep california restaurant market trends in perspective as new information emerges. It also gives owners and buyers a practical way to stay focused on their goals rather than reacting to every headline.
For a buyer, that may mean identifying the business characteristics and operating records that support further diligence. For an owner, it may mean preparing to present the restaurant’s performance clearly and considering how its strengths fit current market conditions. The right next step depends on the transaction, but informed decisions begin with a focused review of the opportunity.
Restaurant For Sale Marketplace connects buyers and sellers with restaurant and bar listings nationwide, alongside brokerage and valuation services for restaurant transactions. Explore restaurant listings and brokerage support to take the next step with a defined plan and reliable business evidence.
Frequently Asked Questions
What are the biggest California restaurant market trends in 2026?
The main issues to assess are customer spending patterns, operating expenses, staffing, and how effectively restaurants adapt their operations. These forces can pull in different directions: a concept may attract interest while still facing pressure from payroll or food purchasing. For a useful read, compare dated industry information with the specific restaurant’s sales, expenses, and operating records. A statewide trend can highlight a question to investigate, but it can’t establish an individual business’s prospects.
Is California's restaurant market growing in 2026?
Available indicators don’t support a simple statewide yes-or-no answer. Visits, sales, restaurant openings, and closures measure different things, and stronger traffic doesn’t necessarily mean higher inflation-adjusted sales or improved profitability. To assess growth, look for current California-specific data and check how it defines growth, the time period covered, and whether figures are observed results or projections. Then compare that measure with the business or segment you’re evaluating rather than applying a broad conclusion to every restaurant.
How do labor and food costs affect California restaurants?
Labor and food costs affect margins through payroll hours, compensation, ingredient purchasing, and the mix of items sold. For example, higher spending on ingredients may coincide with menu price changes or a shift in what customers order, so invoices alone won’t show the full effect. Owners can compare payroll and purchasing records with sales over equivalent periods. Buyers can examine how those expenses are categorized and whether reported results include unusual or nonrecurring costs.
What consumer trends should California restaurant owners watch?
Watch for changes in what guests order, how often they return, when they visit, and whether they choose dine-in, takeout, or another channel. A customer survey about value-conscious spending can suggest a question, but the restaurant’s own transactions show whether its guests are changing their behavior. For instance, compare sales of lower-priced items with average checks and visit frequency. This helps distinguish a broad consumer concern from a meaningful shift in your customer base.
Can California restaurant market trends predict a restaurant's value?
No. Market trends provide context, but they don’t determine what a particular restaurant is worth. Value assessment depends on business-specific evidence, including financial performance, assets, lease terms, and other factors relevant to the transaction. A trend may inform assumptions or risks to examine, but it shouldn’t substitute for substantiated records. Owners preparing for a sale and buyers evaluating an acquisition can use restaurant valuation services to assess business evidence within the market context.
Where can I find reliable California restaurant market data?
Start with dated primary sources and check what each one measures. The National Restaurant Association offers industry research; the U.S. Census Bureau provides economic data that shouldn’t automatically be treated as restaurant-specific findings. The Bureau of Labor Statistics publishes employment and price measures. For state conditions, review specific California Restaurant Association publications and relevant California agency guidance. Restaurant POS reports, payroll records, invoices, and financial statements provide the business-level evidence needed to interpret these sources.


